There are an estimated 3.78 billion people on social media. For a retailer, that is potential 3.78 billion customers, right? Yes, and you would mistakenly think that dumping thousands of dollars on social media marketing – however erratically and disorderedly – would inevitably yield results.

Image credits: Creative Commons
Sadly, that is what most solopreneur retailers do today. They randomly strew content (and blow their hard-earned dollars on campaigns) on social media, HOPING that it generates results.
With the pandemic eating into the finances of many solopreneurs and consequently shrinking their marketing budget, this is definitely the worst time to lack certainty and accuracy in your social media investment. Such certainty is accruable from tracking your social media metrics.
An accurate analysis of such critical metrics makes your social media marketing less of an overly optimistic adventure but more specific, targeted, systematic, and ultimately more successful. With adequate monitoring of these metrics, you would be in a better position to reactively modify your strategy, your execution, and even your budget.
But with the fast-changing dynamics of social media marketing, what metrics should you as a one-man-team retailer watch out for in 2021?
Let me tell you.
1. You should adequately measure your social media reach
Your social media reach is a crucial social media metric you should be watching as a retailer. The reach here indicates the number of eyeballs (or persons) seeing your content or the volume of audience your brand has.
This is a measure of your social media brand exposure. That is, how many people can you touch?
Basically, more extensive reach often translates into bigger chances of customer acquisition or conversion. Most times in social media lead generation, your reach (audience) fills the top layer of the sales funnel. You would not necessarily be able to convert everyone you reach.
However, there is a high propensity of nurturing your audience (within your reach) into leads with time and then possibly converting them at the end of the sales funnel.
But how can you measure your reach?
You can measure your reach from your follower volume, impressions, as well as the overall exposure of each campaign.
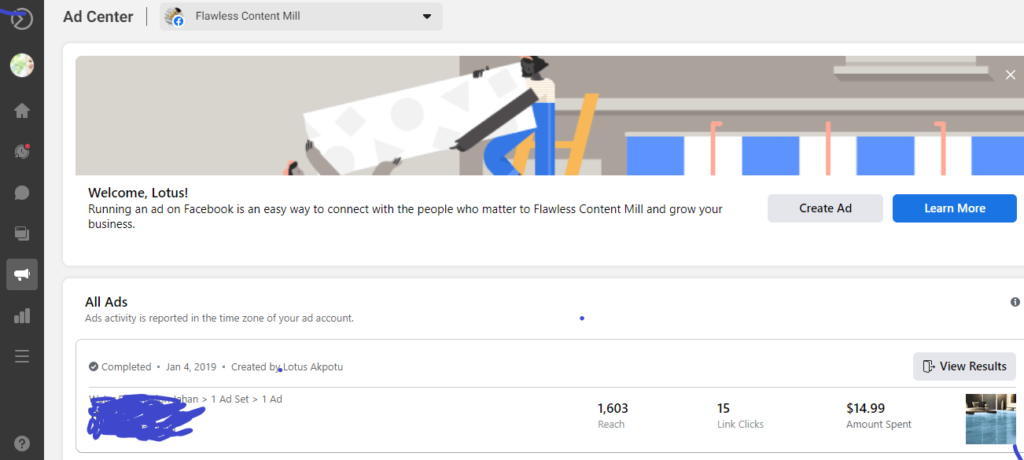
There are different means of measuring reach varying across each platform. For example, on Facebook, you could look at your Facebook Insight to better know the performance of your posts. Averagely, 2.14 billion people are reachable via Facebook adsm – and that is massive.
However, you need more than just a vast social media reach in practice, as we will be learning subsequently. This is because you are a retailer with conversions your ultimate target.
2. You have no choice but to measure your engagement in 2021
Aside from your reach, you have to measure your engagement. In terms of comparative importance, you would be right to pay more attention to your engagement as a retailer.
Simply put, your engagement here refers to the number of people interacting with you on social media. This engagement can be typified in the number of social media shares, the likes you get, the clicks, DMs, comments, favourites, and saves.
These are vibrant yardsticks with which you can check your measurement. Therefore, if your reach is increasing and your engagement is dwindling, drop that bottle of champagne. There is yet no real reason to celebrate.
Having more reach and less engagement is futile as having more friends you can’t call on in time of need. You may as well want to ask yourself. What is the need to produce content if there is no engagement?
Engagement gives you a picture of your content reception.
As a solopreneur retailer, we all know that frustration when you make a post (possibly of your product) say on Twitter, and there are zero likes, zero retweets, and zero comments.
Image credits: David Berkowitz
On social media, decreasing engagement is suggestive of increasing disinterest in your content. Most times, your engagement rate tells you better if you are producing the right content that fits your audience’s persona and interests.
Using Instagram, for example, is a more visual-leaning platform. Photo posts average record 1.74% engagement, carousels averagely record 1.94% engagement and videos 1.45%.
Decked with such data, you know what type of content a particular platform’s audience is more likely to engage with before you go into production. The truth is, your audience is not at gunpoint. If they don’t like your post, they don’t like it, and there is no way you will force them to engage with it.
Engagement also helps you determine if a particular platform is worth investing in. Take Facebook, for example; the average user (when analyzed in October 2020) averagely liked a page, shared one comment, liked 12 posts, and made five comments. On the other end, TikTok’s video engagement rate is 69%!
Which would you want to go for?
In contemporary social media marketing, one significant measure of your engagement capacity as a retailer is your Social Share of Voice (SSoV). How about we learn a bit about this?
Examining your Social Share of Voice (SSoV)
Your Social Share of Voice (SSoV) represents the volume of conversations on social media based on your retail brand. This gives you a clearer perspective on the visibility of your brand, as mentioned by your audience.
These could be direct mentions as typical of customers tagging your brand via your social media handle or indirect mentions where a brand is mentioned without tagging your handle.
The relativity of the SSoV makes it a more valuable metric for measuring your reach as it directly compares your visibility against that of your competitors. The mathematical derivation of the SSoV is seamless.
First, start by calculating the total brand mentions in your industry (or target market) on a social media space within a specific interval. This total should comprise of your mentions and that of your competitors.
Furnished with this total, you would next divide your mentions by the total mentions. The output is multiplied to give you the SSoV rate.
Testing the waters first with engagement before heavy ad investments
For every social media platform you are on, they have their means of measuring your engagement rate. So when you possibly want to run ads, it would be better to start with test ads from which you would measure the engagement.
Feel free to iterate several elements of your content and measure the corresponding variance in engagement. For example, Twitter found after studying 3.7m of its users that tweets having a GIF enjoy 55% more engagement than tweets lacking GIFs.
With iterated modifications to your ads (or ad content), you can serially improve your ads. On Facebook, you could modify your ad content, and you can also adjust the demography and the target audience.
Your impressions should be proportionally commensurate with your engagement metrics. You shouldn’t be having 1,000 impressions and 3 clicks. Indeed, this is worth a huge frown. A resounding indicator that all is not right.
For those ads that continuously perform poorly (as measured from your engagement metrics), you would be right to overhaul them or abandon them altogether.
Don’t keep pushing for so long. You are no Thomas Edison that wants to try a bulb a THOUSAND TIMES before getting it right.
Primarily on social media, while the audience you acquire may be cold and unresponsive at first, with consequent nurturing and energetic relationship building, they would start to engage with your content more.
3. You have to watch out for the virality or amplification rate
As you can rightly infer, amplification refers to how well your content can be amped. The virality rate is relatively new to many retailers (deploying social media marketing); however, it is less important. In a way, it is more related to engagement.
Image credits: SEObility
Specifically, the virality rate refers to how rampantly your content is shared. Mathematically, this is seen as the ratio of shares per social post.
While likes and comments are significant and encouraging for any retailer to show your audience is connecting with you, likes and comments don’t actually amplify your content.
Your followers can comment on your post and like it as well, but it doesn’t necessarily amplify the content itself. This is why sharing is a unique form of engagement.
Sharing amplifies your content allowing your followers to become “digital evangelists” preaching your retail brand. As you know on Instagram, when someone reposts your content, it will enable his audience to see your post. This results in an elegant expansion of your reach, thereby propagating the influence of your content.
If your amplification rate is high, it shows your followers are “real”, not just numbers. They are ready to become volunteer crusaders for your brands, and you wouldn’t have to pay them a dime. That is free marketing, and which retailer doesn’t like that?
Also, your amplification rate gives you a better grasp of the compatibility of the content you are pushing out with the audience persona that platform has.
While Twitter and Instagram users love your content short (and share briefer content), LinkedIn users are likelier to amplify – that is, share – longer content. Statistics reveal that long-form content within the average range of 1,700-2,100 words are most shared on LinkedIn.
When measuring your amplification rate, you track the count of your reposts (as well as shared), dividing it by the number of your followers. The emerging figure would be multiplied by 100. Please don’t be scared; it is no big maths, especially for those who can’t calculate figures with no dollar sign in front of them. Lol.
4. How about the bounce rate?
Here is something that should never be high: the bounce rate. Call it the negativity rate if you like. The bounce rate statistically measures the number of people that clicked on a link in your social media post (or on the link on your profile), land on your retail website, and went off immediately –possibly disinterested, or their spouses called impromptu to break up with them.
Many things inspire bounces. This could be an accidental click or possibly an unwelcoming landing page. Lower bounce rates mean your content is hitting your audience at the right spots keeping them engaged longer on the page.
Bounce rate can be measured on Google Analytics. Go to your Analytics and over to your Acquisition tab. I will show you an example of a website a client recently awarded me to revamp and enhance their metrics.
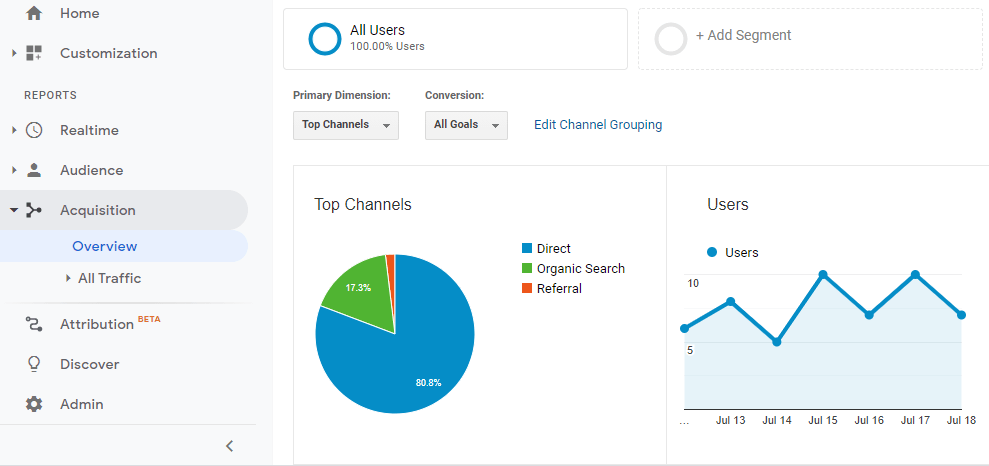
From there, proceed to your All Traffic.
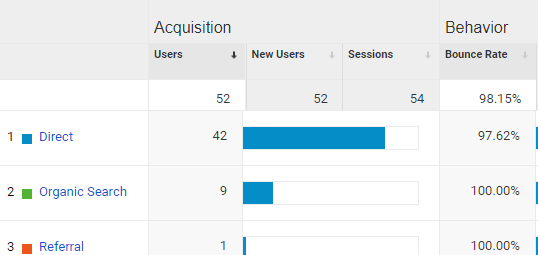
You can locate your Bounce rate from your segmented channels; as you can see from this website, the bounce rate is high, which is not good news.
5. Click-Through Rate is another crucial metric you should be bothered about
Tracking your click-through rate (CTR) allows you to know how efficiently you drive targeted action on your social media. If your goal is conversion via link clicks, measuring your CTR allows you to determine if you are investing in the right social media platform in the first place – or using the right content strategy.
Image credits: Directive Consulting
For example, if you are keen on CTR, you would be looking at platform leverage features like Snapchat’s swipe-ups. Specifically, Snapchat’s swipe-ups boast 5x higher rates than your regular social media click-through rates.
As a retailer in today’s social media, it is almost mandatory to enhance your organic social media outreach with paid ads. If, for example, you run these engagement ads on Facebook, you would have to add a destination website where people who click are directed to.
So if you have your landing page integrated into your ads, you will necessarily have to measure your click-through rate. Your Click Through Rate (otherwise known as CTR) counts the number of people that clicked your content (link) or your ad as the case may be.
When you run social media ads, your CTR is largely responsible for the cost you incur, especially your Google Ads. So if your CTR is low, there is work on your table to do. If your CTR is high, congratulations; you are on the right path, obviously.
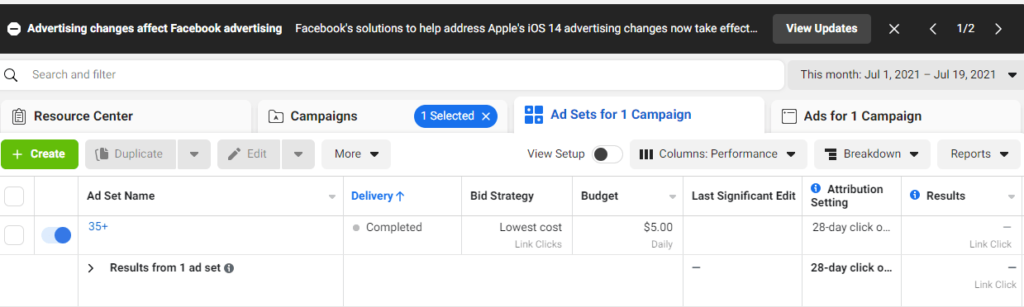
On many social media platforms, they automatically calculate your CTR for your ads. For instance, on Facebook, if you want to view your CTR, you will go to the “Ads” tab.
From there, you would click on that specific ad campaign to have more details on its performance.
There is also a manual way to calculate your CTR. This is gotten when you divide the total number of clicks by the number of impressions. The resultant figure would be multiplied by 100.
6. You dare not ignore your social media referrals
In 2021, social media is one vibrant tool for sharing content, especially from your website. This done well could pull in measurable traction from our social media platforms to your site.
Here is why you need to measure the volume of traffic you are accruing from your social media channels. A referral visit, for example, occurs when people are transported to your website from the links you post on your social media.
So if you happen to publish a post on your blog, you may want to get as many eyes on it as possible. As it is the norm, you would share a link on your social media platforms to pull your followers to your website. This transfer of audience is vital because it is on your website that your followers on social media are most likely to be converted.
Therefore, more than the number of people who engage with your post, you have to measure those following the tunnel down to your website.
With higher social referrals, you are in better control of your brand experience. If your social referral is low, then you would know the compelling edge of your social media content is quite lacking.
Indeed, there are ways to spur a leap in your social media referral. Offerings, promotions, and discounts are great ways to ferry a substantial fraction of your social media audience to your website.
7. Customer Satisfaction Score (CSat)
Many retailers end their correspondence with their customers once the latter buys. This is wrong. A huge part of having a successful retail brand is elongating the customer life cycle, as seen in the percentage of returning buyers you have.
Only satisfied customers will return, correct? This emphasizes the need to measure customer satisfaction. One efficient metric in measuring this on social media is the Customer Satisfaction Score (CSat).
Deriving this metric on social media is pretty easy. All you need to do is design a social media survey investigating the customer appraisal of service delivery.
On a score of 1-10, let them grade how well they have been satisfied (or displeased) with your retail brand. This could be either the quality of your product, delivery, or even customer service.
Arriving numerically at the CSat would involving summing up your total score (from the survey participants) and multiplying by 100.
Thus we have expansively seen the metrics you should be heavily paying attention to as a retailer leveraging social media marketing. Without mincing words, you dare not ignore these social media metrics.
There are many ways to waste time certainly. One could be praying that Dwayne Johnson (such a fitness freak) becomes obese, and two investing in social media marketing as a retailer and failing to monitor these metrics we have mentioned.
Key Takeaways
- Ensure to measure the reach of your content and campaigns, analyzing the exposure your brand has.
- Investigate the quantity and quality of interaction your audience has with your content and campaigns. Keep several iterating elements of your campaigns and measuring the corresponding effects such elements have on your engagement to identify your ideal content type better.
- Click-through rates are a reliable measure of your content relevance with your audience.
- Before pushing out financially intensive campaigns, ensure you have holistically examined your social media metrics to have a more accurate idea of your audience persona.
- Always investigate how sustainably your social media audience interacts with the landing pages your social links lead them to
- Measure the rate at which your extant audience amplifies your content. This gives you a clearer picture of their satisfaction and enthusiasm about your content and campaigns.


